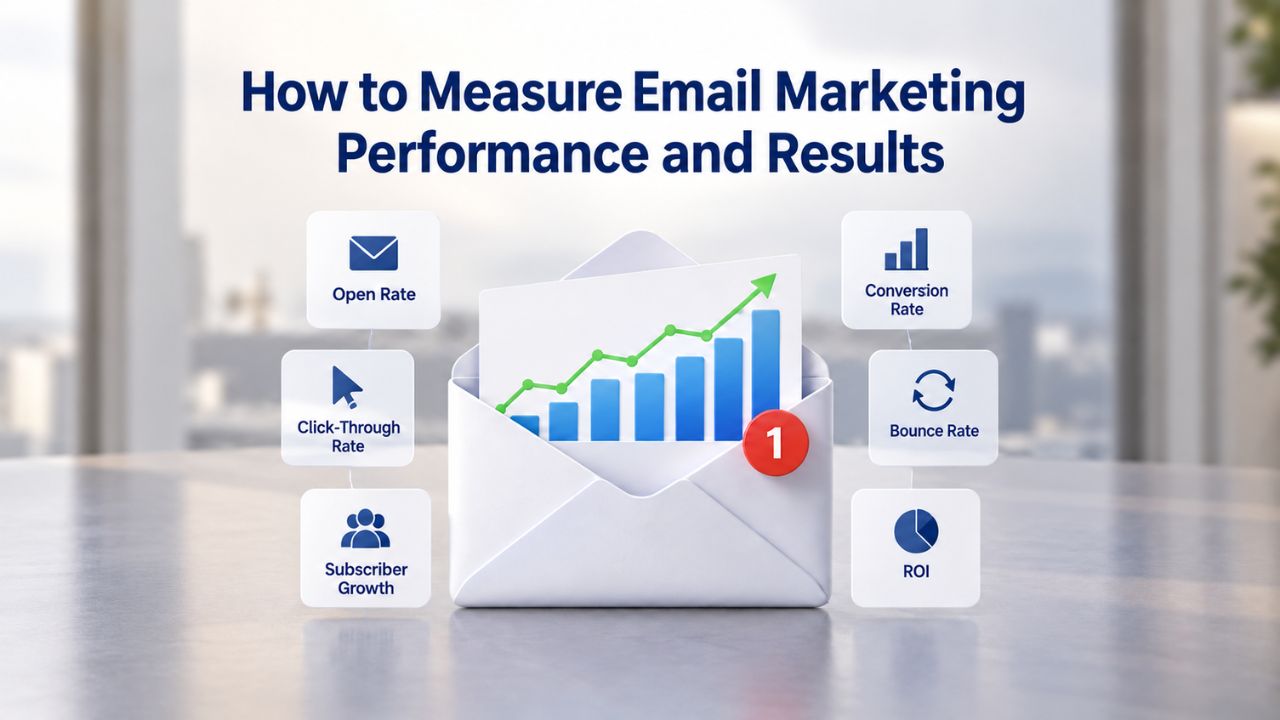
Email campaigns sit in inboxes every day, but most marketers have no idea whether their message moved a customer closer to a sale. Tracking the right metrics transforms guesswork into strategy. This guide covers what to measure, how to interpret industry context, and how to act on the data. Inbox placement depends on standard email authentication, sending reputation, and list quality factors that span platforms; no single tool guarantees deliverability or open rates.
Why Performance Measurement Matters
Email marketing is one of the highest-return channels a business can invest in. Measuring performance helps marketers prove that return, identify which campaigns drive revenue, and avoid wasting budget on approaches that don’t work.

The Business Case for Tracking Results
Numbers without context are noise. If a campaign achieves a 22% open rate, that means nothing unless you know what “good” looks like in your industry and what happened in your previous send. Performance measurement connects email activity to business outcomes, higher revenue per campaign, faster customer onboarding, or reduced churn. Without tracking, marketers rely on intuition instead of data, which leads to repeated mistakes and wasted spend.
Niya Digital’s team has found that businesses often focus exclusively on open rates and miss tracking clicks-to-conversions and list-quality decay, both earlier predictors of campaign performance decline. Setting measurement discipline early prevents months of invisible performance drift.
Compliance and Reputation Risk
Performance metrics are not optional; they’re required by law. The CAN-SPAM Act mandates that senders track unsubscribe requests and manage bounced addresses; GDPR requires consent tracking; CASL imposes similar subscriber-management records. Beyond compliance, monitoring bounce rates, complaint rates, and engagement signals protects your sender reputation. A reputation decline can land 10% to 50% of your mail in spam folders within weeks, tanking campaign performance.
Email Marketing Plans
Email Marketing Beginner
For anyone getting started with email marketing.
- Up to 500 Contacts
- Add more anytime
- Send up to 5,000 Emails/Month
- Single Signup Form
- Basic Image Storage
- Unsubscribe Handling
- Works with Facebook, Etsy & More

Email Marketing Up & Running
Already have clients? This plan’s for you.
- Up to 2,500 Contacts
- Add more anytime
- Send up to 25,000 Emails/Month
- Unlimited Signup Forms
- Unlimited Image Storage
- Unsubscribe Handling
- Works with Facebook, Etsy & More
- Automated Welcome Email
- Converts Blog Posts to Email
- Unsubscribe Options
- Hot Leads List
Email Marketing Pro
For savvy marketers with growing mailing lists.
- Up to 5,000 Contacts
- Add more anytime
- Send up to 50,000 Emails/Month
- Unlimited Signup Forms
- Unlimited Image Storage
- Unsubscribe Handling
- Works with Facebook, Etsy & More
- Automated Welcome Email
- Converts Blog Posts to Email
- Unsubscribe Options
- Hot Leads List
- Auto-sends Event Emails
- Automated Email Campaigns
- Record Signup IPs
- Share Statistics w/Others
Core Metrics Defined
Email marketing platforms report dozens of statistics. The primary metrics below form the foundation every sender must understand.
Open Rate, Click-Through Rate, and Conversion Rate
Open rate measures what percentage of recipients opened your email. It’s calculated as opens divided by successfully delivered emails, then multiplied by 100. A 20% open rate means one in five recipients opened the message. Typical ranges vary by industry; nonprofits often see 25–35%, while retail email averages 15–20%. One caveat: Apple Mail Privacy Protection, introduced in 2021, counts message previews as opens, which inflates reported open rates. This means raw open-rate comparisons before and after 2021 are less reliable.
Click-through rate (CTR) measures the percentage of delivered emails that contained at least one clicked link. It’s calculated as clicks divided by delivered emails, multiplied by 100. Industry averages range from 2–5%, but CTR is more meaningful within your own baseline. A click indicates stronger intent than an open; the subscriber engaged with your content. Conversion rate is the percentage of email recipients who complete a desired action: purchase, signup, or form submission. Unlike open and click rates, conversion is measured by linking email clicks to backend transaction data via UTM parameters or platform integrations. Conversions justify the email marketing budget; open and click rates are interim steps toward that goal.
Bounce Rate, Unsubscribe Rate, and Complaint Rate
Bounces occur when an email fails to deliver. Hard bounces are permanent failures: an invalid email address or a domain that no longer exists. Soft bounces are temporary: the mailbox is full, or the server is unavailable. Maintaining a hard-bounce rate below 2–3% is standard practice. ISPs monitor bounce rates as a sender-reputation signal, so high bounce rates damage your domain reputation and degrade inbox placement. List quality, removing bounced addresses, is foundational performance management.
Unsubscribe rate is the percentage of delivered emails where recipients click the unsubscribe link; typical ranges are 0.5–1.0% per send. A rising unsubscribe rate signals audience fatigue. Complaint rate, the percentage of recipients marking your email as spam, should stay below 0.1%. Complaint rates above 0.1% can trigger ISP filtering and block your sending domain. Monitoring complaint rates weekly prevents reputation crises.
Key Email Marketing Metrics Reference Table
| Metric | What It Measures | Typical Range | Why It Matters |
|---|---|---|---|
| Open Rate | Percentage of delivered emails opened by recipients | 15–25% (varies by industry) | Indicates subject-line effectiveness and audience interest; but inflated by Apple Mail Privacy Protection |
| Click-Through Rate (CTR) | Percentage of delivered emails with at least one clicked link | 2–5% | Stronger than open rate; indicates content relevance and subscriber intent |
| Conversion Rate | Percentage of email recipients who complete desired action (purchase, signup) | 1–5% (email-specific; varies by industry) | Directly tied to business results and ROI; ultimate performance metric |
| Hard Bounce Rate | Percentage of emails failing delivery due to invalid addresses | Below 2–3% | High bounce rates damage sender reputation and trigger ISP filtering |
| Unsubscribe Rate | Percentage of delivered emails where recipients click unsubscribe | 0.5–1.0% | Rising rate signals audience fatigue; helps identify content/frequency issues |
| Complaint Rate | Percentage of recipients marking email as spam | Below 0.1% | Complaint rates above threshold trigger ISP blocking and domain reputation damage |
| List Decay / Inactivity Rate | Percentage of subscribers with no opens or clicks over 6–12 months | 20–25% annually (industry standard) | Indicator of audience health and need for re-engagement campaigns |
Deliverability as a Performance Foundation
Performance metrics are worthless if your emails never reach the inbox. Deliverability, the percentage of sent messages that arrive in inboxes versus spam folders or bounce, is the prerequisite for any campaign success.
Sender Reputation and Authentication
Sender reputation determines whether your email lands in the inbox or spam folder. ISPs and mailbox providers (Gmail, Outlook, Yahoo) evaluate sender reputation using multiple signals: authentication (SPF, DKIM, and DMARC protocols), bounce rates, complaint rates, and engagement (open/click) history. Reputation is not a single score; it’s multidimensional and ISP-specific. High engagement with Gmail users doesn’t automatically mean high engagement with Outlook users.
SPF (Sender Policy Framework) is a DNS record that lists authorized mail servers for your domain. DKIM (DomainKeys Identified Mail) adds a cryptographic signature to your emails, proving they came from your domain and weren’t altered in transit. DMARC (Domain-based Message Authentication, Reporting & Conformance) is a policy layer on top of SPF and DKIM that tells ISPs what to do with unauthenticated mail from your domain. Together, these protocols signal to mailbox providers that your messages are legitimate.
List Quality and Inactive Subscriber Management
A healthy sender reputation starts with a clean list. Sending to outdated, invalid, or unengaged addresses damages reputation faster than any single metric. Industry research shows that even engaged lists lose 20–25% of active subscribers annually due to email address changes, engagement drops, and natural churn. Businesses that ignore list decay find themselves fighting reputation damage within months.
The standard approach is segmentation: identify subscribers who haven’t opened or clicked in 6–12 months, run a re-engagement campaign (a “We miss you” message with a call to action), and remove those who don’t respond. This practice protects reputation and ensures your metrics reflect actual audience interest, not zombie contacts.
Inbox Placement Testing
Deliverability is measured separately from engagement metrics, often through third-party seed-list testing or ISP feedback loops. Seed-list testing sends a test message to a network of inboxes across ISPs and monitors which ones landed in the inbox versus spam folder. This gives a real-world picture of inbox placement rate, typically expressed as a percentage of seeds that hit the primary inbox. High authentication scores and engagement rates typically yield inbox placement above 95%; poor reputation can drop placement to 50% or lower.
Understanding Industry Benchmarks and Realistic Expectations
Benchmarks circulate everywhere: “Average open rate is 21%,” “Normal click rate is 3%.” These numbers are dangerous half-truths if applied rigidly.

Why Benchmarks Vary by Industry and Audience
Email performance varies dramatically by industry, audience, and send frequency. A B2B SaaS company sees different open rates than a retail e-commerce business, which differs from a nonprofit. Subject lines that work for one audience flop for another. Send frequency affects engagement; daily sends fatigue subscribers faster than weekly sends, tanking open and click rates.
Industry averages hide this variation behind a single number. Chasing an industry average instead of understanding your own audience baseline is a trap. A 15% open rate might be excellent for your retail audience but concerning for your B2B segment. The only reliable benchmark is your own historical performance and the variation within your own segments.
Setting Goals Based on Your Own History
Realistic goal-setting starts with your baseline. Pull your last three months of campaign performance, calculate average open rate, click rate, and conversion rate by audience segment, and use those as benchmarks. Your goal is not to match a national average; it’s to improve on your own historical performance. A 2% improvement in click rate or a 10% reduction in bounce rate is a meaningful win, even if it’s below industry average.
Seasonal variation is normal; holiday campaigns see higher engagement, and summer campaigns often decline. Compare performance to the same period last year, not the previous month. Set segmented goals: “Increase clicks by 15% for engaged subscribers” is more actionable than “Achieve a 4% click rate overall.”
Setting Up Conversion Tracking
Open rates and click rates measure email behavior. Conversion rate measures business impact. Without conversion tracking, you don’t know which campaigns actually generate revenue.
UTM Parameters and URL Tagging
Every link in a marketing email should include UTM parameters, small code snippets that tag the link’s source. When a subscriber clicks a tagged link, Google Analytics captures the campaign source, medium, and name, allowing you to trace the click back to a specific email. A properly tagged email link might look like: example.com/product?utm_source=email&utm_medium=newsletter&utm_campaign=spring_sale
This tagging is simple but essential. Without UTM parameters, analytics platforms can’t distinguish email-driven traffic from other sources. Once tagged, you can measure conversion rate, purchases, signups, or events attributed to email clicks, and calculate ROI. Most email marketing platforms, including Niya Digital’s Email Marketing Service, offer built-in URL tagging and Google Analytics integration, eliminating manual work.
Platform Integrations and Event Tracking
For businesses using CRM or e-commerce platforms (Shopify, HubSpot, Stripe), direct integrations eliminate manual linking. A CRM integration lets your email platform log when a subscriber completes a purchase, signup, or custom event, then automatically matches that event to the email campaign that drove the click. No UTM parameter needed; the integration handles attribution behind the scenes.
Set up conversion events in your email platform and backend system. Define what “conversion” means: a purchase over $50, a signup completion, a demo request, a content download. Once defined, track conversions consistently across campaigns. Conversion rate will become your primary performance metric, the one that justifies continued email marketing investment.
Ready to Measure Your Email Performance
Email performance measurement drives better campaigns and stronger business decisions. Tracking the right metrics, understanding context, and acting on data make email marketing a reliable revenue channel. Niya Digital’s Email Marketing Service includes built-in performance analytics, segmentation tools, and integration support to implement these practices. Explore email marketing analytics in action; start tracking performance today.
A/B Testing and Campaign Optimization
The metrics you track only matter if you act on them. A/B testing is how marketers turn data into better results.
Split-Testing Methodology and Statistical Significance
A/B testing (split testing) means sending two versions of a campaign to similar audience groups and measuring which version performs better. You change one variable- subject line, send time, image, CTA text, sender name- and hold everything else constant. After you send both versions, compare the winning metric: open rate, click rate, or conversion rate.
Statistical significance determines whether the difference between versions is real or random chance. With a small sample size, a 5% difference in open rate might be noise; with a large sample size, a 0.5% difference is meaningful. Most email platforms calculate statistical significance automatically and flag the clear winner.
What to Test and Iteration Cadence
The subject line is the most-tested variable; small changes often yield surprising results. Test variations like urgency (“This Friday only”) versus curiosity (“You won’t believe this”), or questions versus statements. After the subject line, test send time, preview text, image, link placement, and CTA text. One test per send is standard; testing too many variables at once makes it impossible to know which change drove the result.
Run tests on segments where you have large enough volume for statistical significance. Testing on 500 subscribers is risky; testing on 5,000 is reliable. Once you identify a winning variant, apply it to future sends. Iteration compounds: a 3% improvement in click rate per quarter becomes 12% per year.
Segmentation and Personalized Performance Measurement
Subscribers are not a monolith. Different audience groups respond to different messages, and you should measure them separately.

Building Audience Segments and Measuring Separately
Segmentation divides your list into groups based on shared characteristics: purchase history, engagement level, industry, company size, or location. A segment might be “high-engagement subscribers who clicked in the last 30 days” or “inactive subscribers who haven’t opened in 6 months.” Sending tailored campaigns to each segment typically lifts open rates by 14–100% and click rates by 25–150%, depending on segment depth and message relevance.
Once segmented, measure performance separately for each segment. A campaign might achieve a 20% open rate overall, but 35% within an engaged segment and 8% within an inactive segment. These splits reveal which audiences respond to which content. Your engaged subscribers might prefer daily updates; your inactive subscribers might re-engage with a weekly summary. Tailored cadence and content drive performance gains that mass sends can’t match.
Personalization at Scale
Personalization goes beyond segmentation. Insert subscriber first name, reference their recent purchase, or suggest products based on past behavior. Personalized emails consistently outperform generic ones because they feel relevant; recipients are more likely to open, click, and convert. The barrier to personalization is technical: you need data (names, purchase history, browsing behavior) and a platform that supports dynamic content.
Most email marketing platforms now support basic personalization (name, location, recent purchase) out of the box. Niya Digital’s Email Marketing Service includes segmentation and dynamic content blocks, allowing you to personalize at scale without manual effort per subscriber. Measure performance gains from personalized versions versus generic versions in the same segment; you’ll often see a 10–20% performance lift.
Identifying and Re-Engaging Inactive Subscribers
List decay is universal. The longer a subscriber sits inactive, the higher the risk they’ll never engage again, and the greater the damage to your sender reputation.
Engagement Decline Patterns and Segmentation
Inactive subscribers are those who haven’t opened or clicked any email in 6–12 months. Repeatedly sending to inactive users damages sender reputation because ISPs interpret inactivity as disinterest or spam. The longer you ignore list decay, the steeper your reputation decline. By month three of inactivity, your domain’s inbox placement likely already suffers.
Segmenting inactive subscribers separately accomplishes two goals: it protects your reputation (you stop sending volume to engaged targets), and it creates a dedicated re-engagement audience. Run campaigns designed to win them back, emphasize what’s changed, ask why they’ve been silent, offer an incentive to re-engage, or ask them to confirm they want to stay subscribed.
Re-Engagement Campaign Mechanics
A standard re-engagement campaign runs across 4–8 weeks. Week 1: send a “We miss you” message asking if they want to stay subscribed, with a clear confirmation link. Week 2–3: wait for responses. Week 4: send a second message to non-responders with an incentive (discount, free content). After week 4, remove any subscribers who still don’t click from your list. This process protects reputation and removes dead weight.
Most email platforms support re-engagement automation. Niya Digital’s Email Marketing Service includes automation workflows designed for re-engagement campaigns, reducing manual effort. Track re-engagement rate separately: what percentage of re-engaged subscribers re-confirmed? This metric tells you how much of your inactive list was genuinely lost versus temporarily dormant.
Monitoring and Maintaining Sender Reputation
Sender reputation builds over months and can be damaged in days. Continuous monitoring prevents reputation crises.
Weekly Metrics to Monitor
Check bounce rate, complaint rate, and engagement rate weekly. Set alerts: if hard bounce rate exceeds 3%, stop sending and investigate list quality. If complaint rate exceeds 0.1%, pause campaigns and audit list sources and consent practices. If engagement rate (opens + clicks / delivered) drops below your historical baseline, investigate whether content quality has declined or send frequency is too high.
Authentication compliance is a prerequisite; verify that SPF, DKIM, and DMARC are correctly configured for your sending domain. Most email platforms provide setup guides and validation tools. Configuration errors are common and cause silent deliverability problems; verify correct setup at least quarterly.
Reputation Recovery Practices
If reputation declines, recovery takes weeks. Reduce send volume, pause campaigns to inactive users, clean your list aggressively (remove all non-openers in 12+ months), and improve list sources (preference centers, double opt-in, verified consent). Inbox placement may not recover fully for 4–12 weeks, depending on damage severity.
Prevention is far easier than recovery. Maintain list hygiene monthly, monitor weekly metrics consistently, and re-engage inactive subscribers on schedule. These disciplines protect reputation and keep inbox placement stable. Niya Digital’s Email Marketing Service includes authentication support and reputation-monitoring tools, making routine maintenance straightforward.
Building a Performance Dashboard and Measurement Cadence
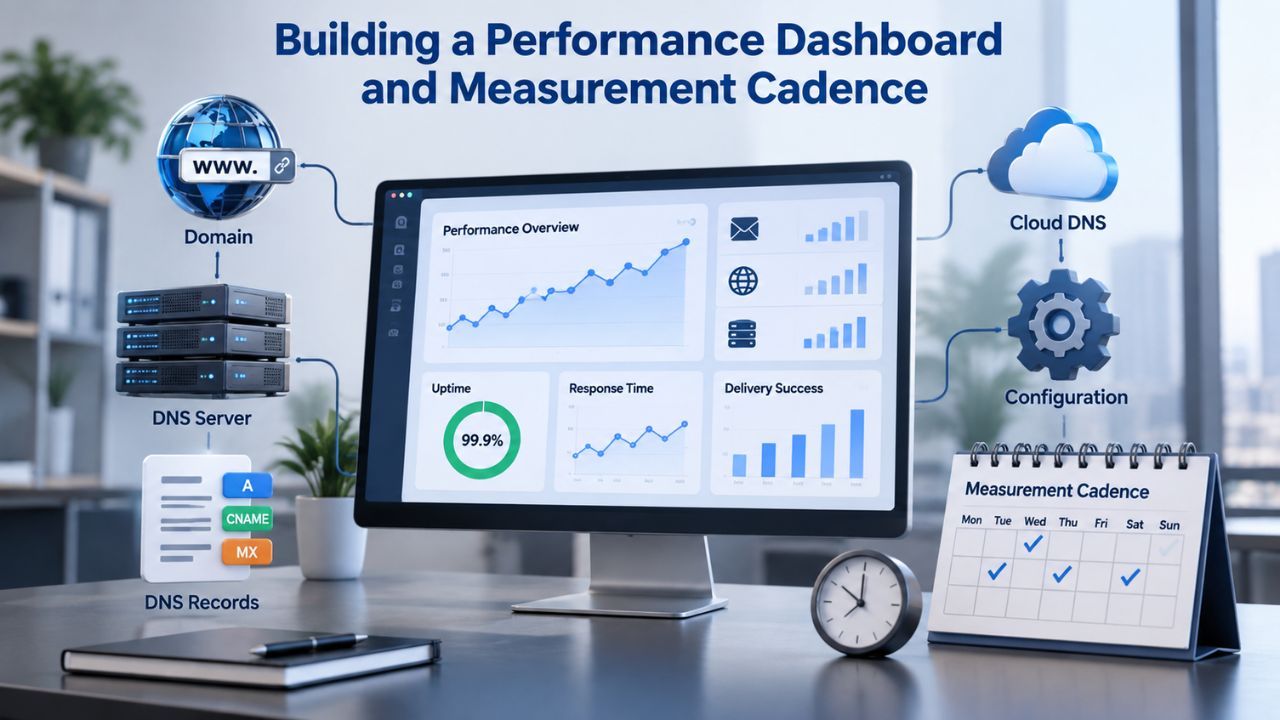
Tracking metrics is useless if insights get lost in noise. A performance dashboard brings the key numbers together, and a consistent measurement cadence ensures you act on data.
Dashboards: Deciding What to Track
Not every metric deserves a dashboard. Vanity metrics (like total emails sent) are interesting but not actionable. Decision metrics (open rate, click rate, bounce rate, complaint rate, conversion rate) drive real business choices. A simple dashboard might include: overall open/click rate this month, segment-level engagement breakdown, bounce rate trend, conversion rate by campaign, and re-engagement rate.
Add targets to each metric: “Target: 20% open rate, 3% click rate, <2% hard bounce rate, <0.1% complaint rate.” When actual performance deviates from target, it triggers an investigation. Dashboards prevent metric blindness, the tendency to assume everything is fine when specific numbers actually signal decline.
Monthly Cadence and Audience Health Checks
Most businesses measure weekly, but act monthly. Weekly reports catch outlier campaigns or reputation spikes; monthly reports show trends. Schedule a monthly “email health” meeting: review overall performance, segment performance, list decay, and sender reputation. Identify underperforming campaigns, audience segments losing engagement, or list-quality issues. Then adjust strategy: test new subject lines, refresh content, or pause campaigns to declining segments.
Quarterly business reviews should include email’s contribution to overall revenue, email cost per acquisition, and the lifetime value of email-acquired customers. These numbers justify continued investment and inform budget decisions. Niya Digital’s Email Marketing Service dashboards support this reporting, providing historical trend data and segment breakdowns in one view.
Email Performance Improvement Workflow
| Step | What It Identifies | Frequency | Expected Outcome |
|---|---|---|---|
| Audit Authentication & Deliverability Setup | SPF, DKIM, DMARC configuration; baseline inbox placement rate | Quarterly | Correct authentication prevents future reputation issues and silent delivery problems |
| Generate Monthly Performance Baseline Report | Overall and segment-level open rate, click rate, conversion rate, bounce rate, complaint rate | Monthly | Establishes your benchmark; identifies segments trending downward; catches reputation damage early |
| Segment List by Engagement Level | Divide subscribers into active (opened/clicked 0–3 months), at-risk (3–6 months), inactive (6+ months) | Monthly | Enables tailored send cadence and re-engagement strategy; protects reputation by reducing sends to inactive users |
| Run A/B Test on High-Volume Segment | Test subject line, send time, image, or CTA against control; measure statistical significance | Per campaign | Identifies winning variant; compounds iteratively (3% improvement per quarter = 12% annually) |
| Launch Re-Engagement Campaign to Inactive Segment | Send “We miss you” message, wait for response, run second message with incentive, remove non-responders | Quarterly | Recovers 10–30% of inactive subscribers; removes dead weight; protects sender reputation from list decay |
| Monitor Weekly Reputation Signals | Hard bounce rate, soft bounce rate, complaint rate, engagement rate trends | Weekly | Early warning system; prevents reputation crisis by catching threshold breaches before ISP action |
| Clean List of Undeliverable Addresses | Remove hard bounces and invalid addresses identified in past month | Monthly | Maintains bounce rate below 2–3%; signals list quality to ISPs; prevents reputation damage from accumulated invalid addresses |
Ready to Track Email Performance Data
Email metrics reveal business truth. Open rates, clicks, conversions, and reputation signals guide every optimization, and they’re only useful if you measure consistently and act on what the data shows. Niya Digital’s Email Marketing Service provides end-to-end performance tracking: analytics dashboards, segmentation, automation, and conversion attribution. Turn email campaigns into a measurable, optimized channel; start tracking performance holistically today.
Frequently Asked Questions
What is a good email open rate?
Open rate depends on industry, audience, and send frequency. Nonprofit emails average 25–35% opens; retail averages 15–20%; B2B SaaS averages 20–30%. Your historical baseline matters more than an industry average. If your typical open rate is 18% and a campaign hits 22%, that’s a genuine win; you’ve outperformed your own performance. Track your own trend over time rather than comparing to an external benchmark.
How often should I send emails to avoid unsubscribes?
Send frequency is audience-dependent. Engaged audiences tolerate daily sends; unengaged audiences churn at weekly frequency. Start with weekly sends, measure unsubscribe rate, and adjust based on feedback. If unsubscribe rate exceeds 1% per send, reduce frequency. Segment by engagement level: send engaged subscribers more frequently, inactive subscribers less frequently. Flexibility prevents fatigue-driven unsubscribes.
What is a bounce and why does it matter?
A bounce occurs when an email fails delivery. Hard bounces are permanent (invalid address, domain no longer exists); soft bounces are temporary (mailbox full, server temporarily unavailable). Bounces damage sender reputation: ISPs monitor bounce rates as a trust signal. Keep hard bounce rate below 2–3% and soft bounce rate below 5% by maintaining list hygiene and removing invalid addresses monthly.
How do I calculate conversion rate from email campaigns?
Conversion rate is (conversions from email / delivered emails) × 100. To measure conversions, tag all email links with UTM parameters or use your email platform’s built-in conversion tracking. When a subscriber clicks an email link and completes a desired action (purchase, signup, form submission), your analytics platform attributes that action to the email campaign. Most email marketing platforms automate this process.
Why does Apple Mail Privacy Protection affect my open rates?
Apple Mail Privacy Protection, introduced in 2021, counts message previews as opens. This means iPhones and Macs now report opens for emails the recipient never actually read, just viewed in a preview window. Raw open rate comparisons before and after 2021 are unreliable. Clicks and engagement remain accurate signals. Focus on click rates and conversions as primary metrics.
What is sender reputation and how do I improve it?
Sender reputation is an ISP evaluation of your trustworthiness, based on authentication (SPF, DKIM, DMARC), bounce rates, complaint rates, and engagement. Improve it by: configuring authentication correctly, maintaining list quality (remove invalid addresses), monitoring complaint rates, and re-engaging inactive subscribers regularly. Recovery from reputation damage takes 4–12 weeks; prevention through consistent discipline is far easier.
Should I use a double opt-in or single opt-in signup process?
Double opt-in (subscriber receives a confirmation email and must click a link to confirm subscription) results in a smaller immediate list but higher list quality and lower future bounce rates. Single opt-in (subscriber confirms immediately) grows lists faster but admits more invalid addresses and disinterested subscribers. For compliance-sensitive businesses, double opt-in provides proof of consent. For growth-focused businesses, single opt-in with aggressive list maintenance is acceptable.
How do I know if my send time is optimal?
A/B test send times. Split your audience, send version A at 9 AM and version B at 3 PM, then compare open rates and click rates. Repeat across different days and times to identify patterns. Industry-wide, Tuesday–Thursday at 9–10 AM sees high engagement, but your audience may differ. Use your platform’s built-in send-time optimization tools to automate this process.
What does segmentation do for email performance?
Segmentation divides your list into groups based on behavior or characteristics, then sends tailored content to each group. Segmented campaigns typically see 14–100% higher open rates and 25–150% higher click rates than mass sends. Segments might be by engagement level (active versus inactive), purchase history, industry, or location. Start with basic segmentation (engaged vs. inactive) and expand as your data grows.
How often should I audit my email list for bounces and invalid addresses?
Audit your list monthly for hard bounces and remove all invalid addresses. Soft bounces typically retry automatically; you’ll know which addresses are permanently invalid after 3–5 attempts. Most email marketing platforms offer list-cleaning tools that identify and flag invalid addresses. Removing bounced addresses prevents reputation damage and ensures accurate performance metrics.
What is list decay and how do I prevent it?
List decay is the natural loss of engagement over time; subscribers change email addresses, lose interest, or become inactive. Even engaged lists lose 20–25% of active subscribers annually. Prevent it by monitoring engagement regularly, running re-engagement campaigns to inactive subscribers, removing non-responders after 12 months, and using preference centers to let subscribers adjust frequency rather than unsubscribe.
What is a re-engagement campaign and when should I run one?
A re-engagement campaign targets subscribers who haven’t opened or clicked in 6–12 months. It’s a series of emails that asks whether they want to stay subscribed, offers an incentive to re-engage, and removes non-responders. Run re-engagement campaigns quarterly. Most email platforms automate the process: segment inactive subscribers, send the campaign automatically, and track re-engagement rate (percentage who re-confirm subscription).
How do I measure email ROI?
Email ROI is (revenue from email – email platform cost) / email platform cost. To calculate it: tag all email links with UTM parameters or use conversion tracking to measure revenue directly attributable to email. Calculate customer acquisition cost (total email spend / new customers acquired via email) and lifetime value (revenue per email-acquired customer over their lifetime).
What metrics should appear on my email performance dashboard?
A basic dashboard includes: open rate (overall and by segment), click rate (overall and by segment), bounce rate (hard and soft), complaint rate, conversion rate, unsubscribe rate, and list size trend. Add targets to each metric so you can spot deviations from baseline. Review weekly for outliers; review monthly for trends. This prevents metric blindness and surfaces problems early.
Why is engagement rate more important than open rate alone?
Open rate has limitations (Apple Mail Privacy Protection inflates it, mobile previews count as opens) and doesn’t prove intent. Engagement rate (opens + clicks combined) is more reliable: it requires actual interaction. Click rate is even stronger: it proves the subscriber found your content interesting enough to click. For optimization, focus on clicks and conversions; they’re harder to game and directly predict revenue.
Glossary
- Click-Through Rate (CTR): The percentage of delivered emails that contained at least one clicked link. Calculated as (clicks / delivered emails) × 100. Industry average is 2–5%. CTR indicates audience interest and is a stronger signal of campaign success than open rate alone.
- Conversion Rate: The percentage of email recipients who completed a desired action (purchase, signup, form submission). Measured by linking email clicks to backend transaction or event data via UTM parameters or platform integrations. Conversion rate is the ultimate performance metric; it connects email activity directly to business results.
- Double Opt-In: A subscription confirmation process where the subscriber receives a confirmation email and must click a link to complete signup. Results in a smaller initial list but higher list quality and lower bounce rates. Often required for compliance-sensitive industries.
- Engagement Rate: The combined percentage of subscribers who opened or clicked an email. More reliable than open rate alone because it requires active interaction. Calculated as (opens + clicks) / delivered emails.
- List Decay: The natural loss of engagement over time as subscribers change addresses, lose interest, or become inactive. The industry standard is 20–25% annual decay, even in engaged lists. Managed through re-engagement campaigns and regular list maintenance.
- Sending Reputation: An ISP’s trust evaluation of a sender, based on authentication (SPF, DKIM, DMARC), bounce rates, complaint rates, and engagement history. A good reputation yields high inbox placement; a poor reputation results in spam-folder delivery or blocking. Built over months and damaged in days.
- Segmentation: Dividing a subscriber list into groups based on behavior, characteristics, or engagement level. Allows tailored content per segment and separate performance measurement. Segmented campaigns typically see 14–100% higher open rates than mass sends.